





BI Strategy & Metric Discovery
Auditing existing reports and spreadsheets, interviewing the people who use them, and agreeing on the metrics that actually drive decisions before a dashboard is designed.

Browse our current openings and find a role that matches your skills and ambition.
Know more ▸
Get a feel for our culture, our people and the way we work together every day.
Know more ▸
Health, flexibility and growth benefits designed to support you and your family.
Know more ▸

Kickstart your career with hands-on internship opportunities and mentorship.
Know more ▸
Every team already has reports: spreadsheets, exports, slide decks, one-off queries. Business Intelligence is how 3Shadz turns that scatter into governed metrics, clear dashboards, and self-service views that agree with each other, so a decision made from a report holds up when someone checks it later.
A dashboard with nice charts is not Business Intelligence.
3Shadz designs the semantic models, metric definitions, and reporting architecture that sit between your warehouse and the people who need the numbers, then builds the dashboards, reports, and self-service views on top of it. That means deciding what “active customer” or “on-time delivery” actually means before a single chart is drawn, so finance, operations, and leadership are never quietly answering different questions with the same label.
The goal isn’t a dashboard that impresses in a demo. It’s a report someone still trusts enough to open first, six months after launch, without checking the number against a spreadsheet.
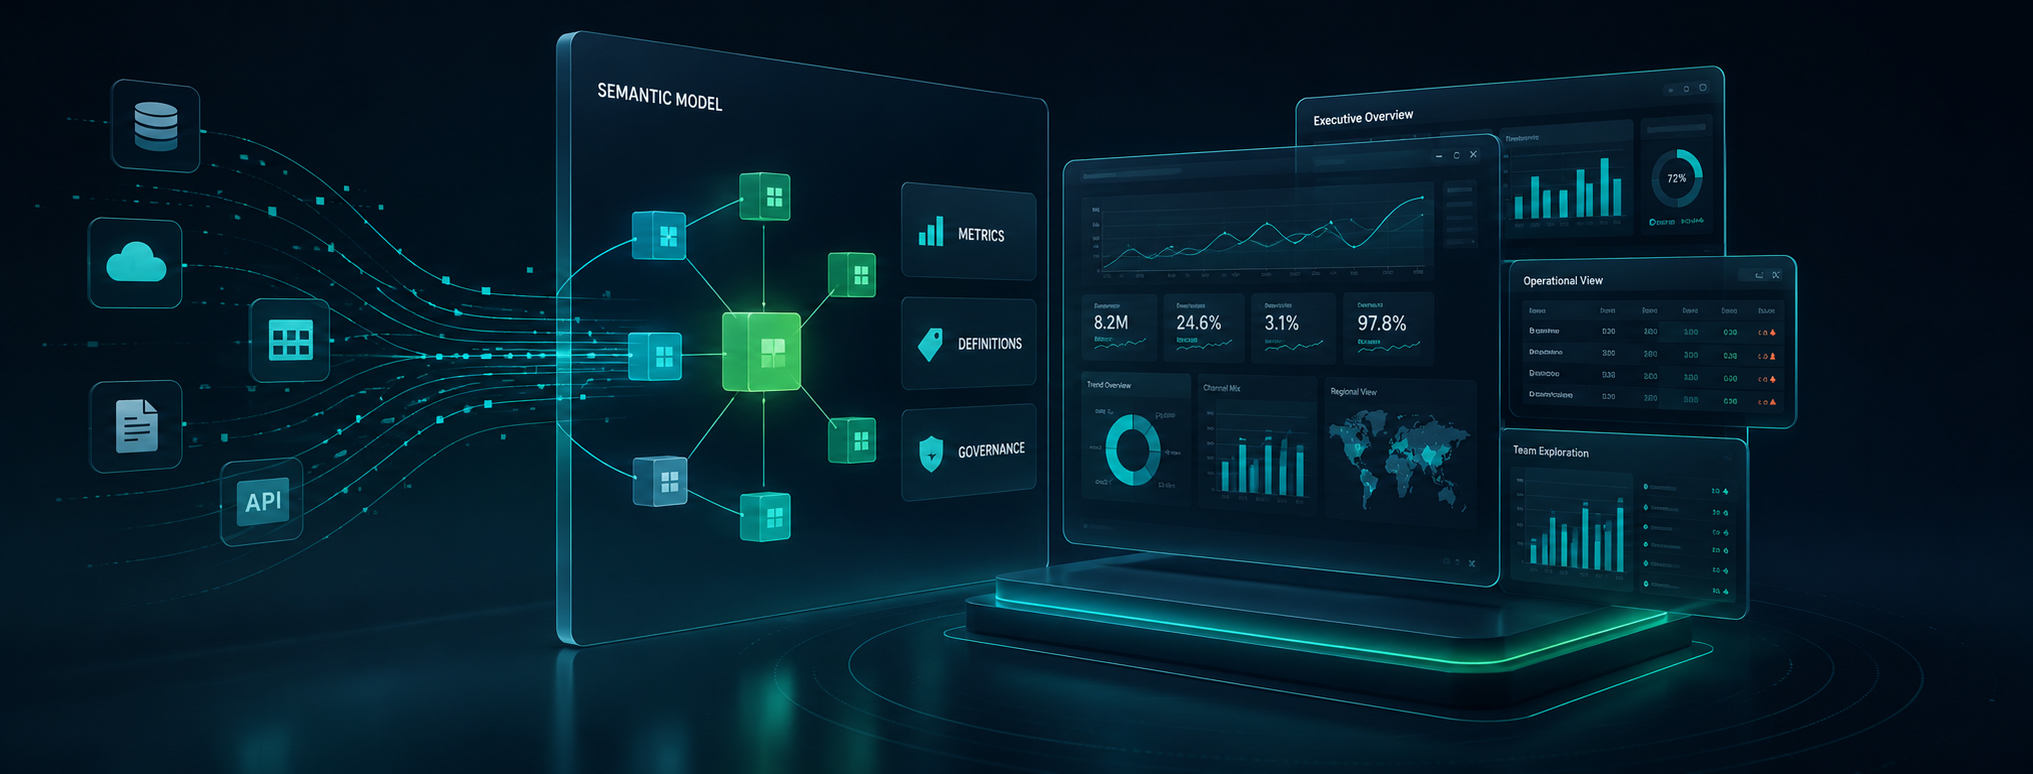
Most engagements touch several of these at once: the modelling, the build, and the governance are rarely separable in practice.
Auditing existing reports and spreadsheets, interviewing the people who use them, and agreeing on the metrics that actually drive decisions before a dashboard is designed.
Building the metric and dimension layer between your warehouse and your reporting tool, so “revenue” or “churn” is calculated the same way everywhere it’s used.
Documenting metric owners, definitions, and calculation logic, and certifying the datasets people are allowed to build on top of.
Designing and building executive, operational, and departmental dashboards in Power BI, Tableau, Looker, or Qlik, sized to how each audience actually reads a screen, not a single template stretched to fit everyone.
Structured workspaces, row-level security, and training that let business users explore governed data confidently, without every user rebuilding the same report from scratch.
Moving legacy, spreadsheet-based, or single-vendor reporting onto a modern BI platform without losing the institutional knowledge baked into the old reports, and retiring the ones nobody actually opens.
Embedding governed dashboards inside your own products and portals, and building near-real-time views for operational teams who can’t wait for an overnight refresh.
A KPI card only tells you something moved. Dashboards are built with the hierarchy and drill paths to let someone go from that number to the reason behind it, in the same view.
The same four stages carry every engagement, whether it starts with one report or a full reporting platform.
Audit existing reports and spreadsheets, interview the people who rely on them, and agree on the metrics and definitions that matter before opening a BI tool.
Build the metric and dimension layer that sits between the warehouse and the dashboard, so every report calculates the same thing the same way.
Build dashboards and reports around how each audience actually makes decisions: the right level of detail for the boardroom, the floor, and the analyst’s own exploration.
Roll out access, documentation, and training alongside the dashboard, then track usage and retire or refine what isn’t working.
Metric drift rarely comes from bad data. It comes from the same word being calculated three different ways in three different tools.
A dashboard is only worth what it replaces. We measure success by what stops happening: the spreadsheet nobody rebuilds, the number nobody has to double-check.
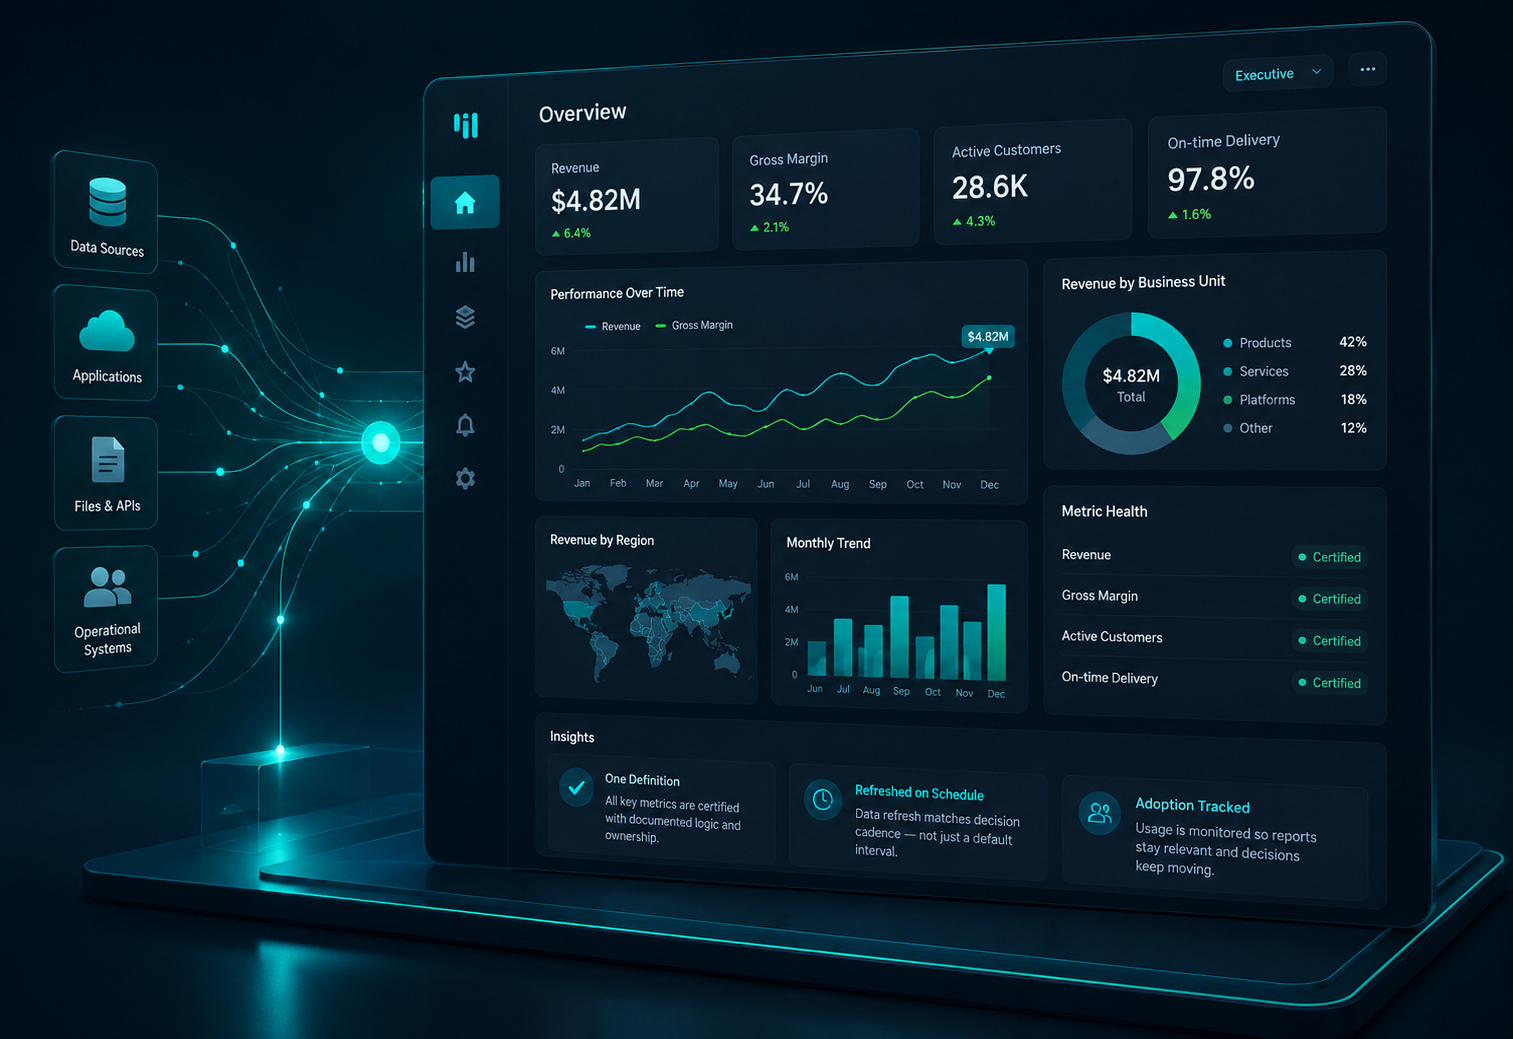
Most BI projects don’t fail at launch. They fail three months later, when the numbers quietly stop matching. Here’s what keeps ours from getting there.
Metrics are defined once and reused everywhere, so finance, ops, and leadership are always looking at the same number.
Each dashboard is scoped to a specific audience and decision, not a generic template stretched to serve everyone.
Role-based access and certified datasets keep self-service safe without blocking people from exploring the data.
Models and queries are optimized so dashboards load quickly at the concurrency your teams actually use.
We choose the BI platform and semantic layer that fit your stack and licensing, not the vendor we prefer.
The same team that models your metrics also builds the pipelines, warehouse, and governance underneath them.
We choose the visualization tool, semantic layer, and delivery method that fit your constraints and existing stack, not the other way around.
Data & Analytics, under Services, is the umbrella practice covering engineering, warehousing, scale, insight, and governance. Business Intelligence is the specific discipline underneath it: the semantic models, dashboards, and reporting experiences that turn stored data into something people across the business can understand and use.
Data Engineering moves data reliably and Data Warehousing models and stores it. Business Intelligence sits on top of both: it defines the metrics, builds the semantic layer, and designs the dashboards people actually open. Most engagements involve all three, often as one continuous build.
Yes. We regularly build on Power BI, Tableau, Looker, Qlik Sense, and Metabase, and choose the platform that fits your existing stack, licensing, and embedding needs rather than defaulting to one vendor.
A semantic layer is the modelled layer between your warehouse and your dashboards that defines what each metric means once, so every report calculates it the same way. Most organizations don’t need one until reports start disagreeing, at which point it becomes the fastest way to fix it permanently rather than dashboard by dashboard.
Self-service is scoped to governed datasets and certified metrics rather than raw tables, with workspace structure and row-level security defined up front, so business users can explore and build without redefining what a metric means along the way.
Yes. We track usage, refresh performance, and query cost after launch, and revise or retire reports as questions and data change, rather than treating go-live as the end of the engagement.
Whether you need one dashboard, a semantic layer, a self-service rollout, or a full reporting platform, our Business Intelligence team can help you get there.